Name the quantity being compared
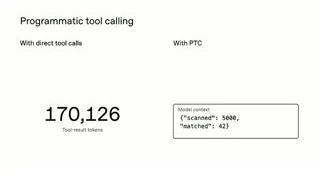
The left side already holds a large token count. On the right, a compact filtered result sits in a model-context box. The sentence makes this spatial contrast about token use.
05 / 12 · Technical launch
An incident investigation gives the technical features a common purpose. A sparse two-column diagram then turns one efficiency claim into a comparison the viewer can read.
Official source: Introducing the Agents API ↗
01 / A sentence, inspected closely
Select a word to see its corresponding source frame. Use the arrow keys within the word buttons to step through. Frames may stay similar when a shot holds.
“fewer tokens spent passing around raw data”
Reading · interpretation
The left side already holds a large token count. On the right, a compact filtered result sits in a model-context box. The sentence makes this spatial contrast about token use.
The seven displayed words agree with the retained channel subtitle track. Their individual onsets are machine estimates from the source audio, not listening-verified synchronization points.
The left side already holds a large token count. On the right, a compact filtered result sits in a model-context box. The sentence makes this spatial contrast about token use.
The right-hand result remains visible as the clause describes spending tokens on moving data. The preceding diagram supplies the explanation: code filters the logs before a compact result enters context.
By these sampled word onsets, both columns have resolved into counts. The frame holds through the remaining contrast, giving the viewer a stable pair to inspect. Those figures are the film's illustration, not a benchmark independently verified by this study.
02 / Directing attention
The presenter introduces and interprets the claim. Dark terminal captures show the technical material. White diagrams strip that material down to a relationship. Moving between them helps distinguish explanation from the detailed example.
The direct-call approach stays on the left and the programmatic approach on the right. Each side develops within its own column, then resolves into a count at the same visual level. The audience can compare without relocating the subjects.
The investigation ends in a document containing an assessment, evidence and proposed response. Showing the report after the terminal sequence changes the scale from internal process to something an on-call team could inspect.
03 / Beyond the excerpt
The opening names the infrastructure work around an agent before introducing the API. A simple app–harness–sandbox diagram explains the division of responsibility. The film then follows one incident investigation through connected tools, instructions, environment choices, log filtering, delegated work, compaction and a final report. These are distinct capabilities, but the incident supplies continuity. The report is the sequence's concrete destination; the closing returns to the developer benefit introduced at the start.
Passage boundaries below are approximate. Speech is paraphrased; the word explorer above contains the short quotation. Editorial jobs are interpretations.
The presenter names the surrounding infrastructure work and introduces a service intended to handle it.
A table view gives way to a closer view and a brief product label.
Editorial job · Establish the problem before naming the offering.
The hosted harness and its responsibilities are explained.
A white diagram places the harness between the application and sandbox, then adds responsibilities inside it.
Editorial job · Make the division of work legible.
An incident investigation needs data, recent changes and a runbook.
The presenter introduces the example; terminal views alternate with selected configuration beside him.
Editorial job · Give the feature list one continuing task.
Environment choices are followed by the problem of too many logs for context.
Configuration appears beside the presenter, then dense log output fills a dark terminal view.
Editorial job · Show both control and the scale of the information problem.
Filtering in code is explained as a way to reduce the raw data passed into context.
A two-column diagram progresses from calls and results to a pair of token counts.
Editorial job · Make a technical mechanism comparable at a glance.
The example expands to delegated investigation and continuation through compaction.
Terminal work returns, followed by table and close views of the presenter.
Editorial job · Explain additional capabilities within the same incident.
The completed investigation should become a report with evidence and next steps.
A terminal result leads into a document that scrolls from assessment to proposed response.
Editorial job · Give the workflow a reviewable destination.
The presenter returns to the benefit of maintaining less infrastructure and closes the launch.
Close and table views lead into the brand ending.
Editorial job · Resolve the original developer problem.
04 / Check the actual image change
These pairs use neighboring decoded source frames. Their timestamps are frame evidence; they do not make the speech alignment exact.
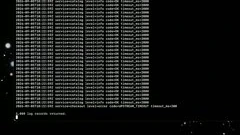
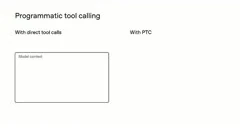
Dense terminal logs remain at 66.567 seconds. At 66.608 the white two-column diagram appears. The cut changes the task from perceiving volume to understanding how the information is handled.
Watch around this transition ↗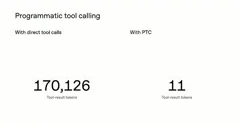

The two counts are still visible at 78.245 seconds. At 78.287 a dark terminal window replaces them for the next capability. The finished comparison is given a hold before the technical example resumes.
Watch around this transition ↗Proposed use in the all-hands
Carry one real task through a technical explanation. When a mechanism is difficult to read in a screen capture, use a simple diagram that preserves the task's actual relationships. Return to the real result afterward. If using a numerical comparison, retain the measurement basis and avoid presenting an illustrative number as a validated result.
Open the storyboard worksheet →Scope of the reading
The diagrams and on-screen counts communicate the film's claims. This review does not verify API behavior, reproduce the incident investigation or establish a benchmark. The small captures support composition analysis; they are not a substitute for reading or executing the source code.
The full machine transcript was read; 393 estimated words were mapped to source frames. The visual review inspected 276 half-second sample positions, the 7 selected word frames and these 2 native transition windows. Available caption differences were checked. No continuous playback or human listening verification. Method and timing limits.
The earlier reading in the latest-100 study · Structured close readings